Real-World SEO Benchmarks: Data-Driven Standards for 2025

Hand off the toughest tasks in SEO, PPC, and content without compromising quality
Explore ServicesSEO can feel like you’re throwing darts blindfolded.
Sure, you’re doing the work, but are you actually hitting the target?
Here’s how you can tell: use SEO benchmarks—reference metrics that measure a site’s performance against industry standards and competitors.
Let’s ditch the guesswork and nerd out on numbers 👇
Essential SEO Benchmarks to Track in 2025
To make things easy, I’ve broken down the below SEO benchmarks into five categories:
- Core search performance is the big picture stuff—how visible is a website in search results, and how much traffic is it getting from organic search?
- Technical SEO metrics are all about the behind-the-scenes practices that make a website run smoothly and efficiently for both users and search engines.
- User engagement metrics tell you how engaged visitors are with a website—are they bouncing immediately, or are they sticking around and exploring?
- Content performance focuses on how well content performs in search—is it ranking for relevant keywords, attracting clicks, and satisfying user intent?
- Link-building metrics look at the quality and quantity of backlinks pointing to a website, a key indicator of its authority and trustworthiness.

1. Core Search Performance
Alright, let’s start with the big guns: the core metrics that show you how well your website is performing in search.
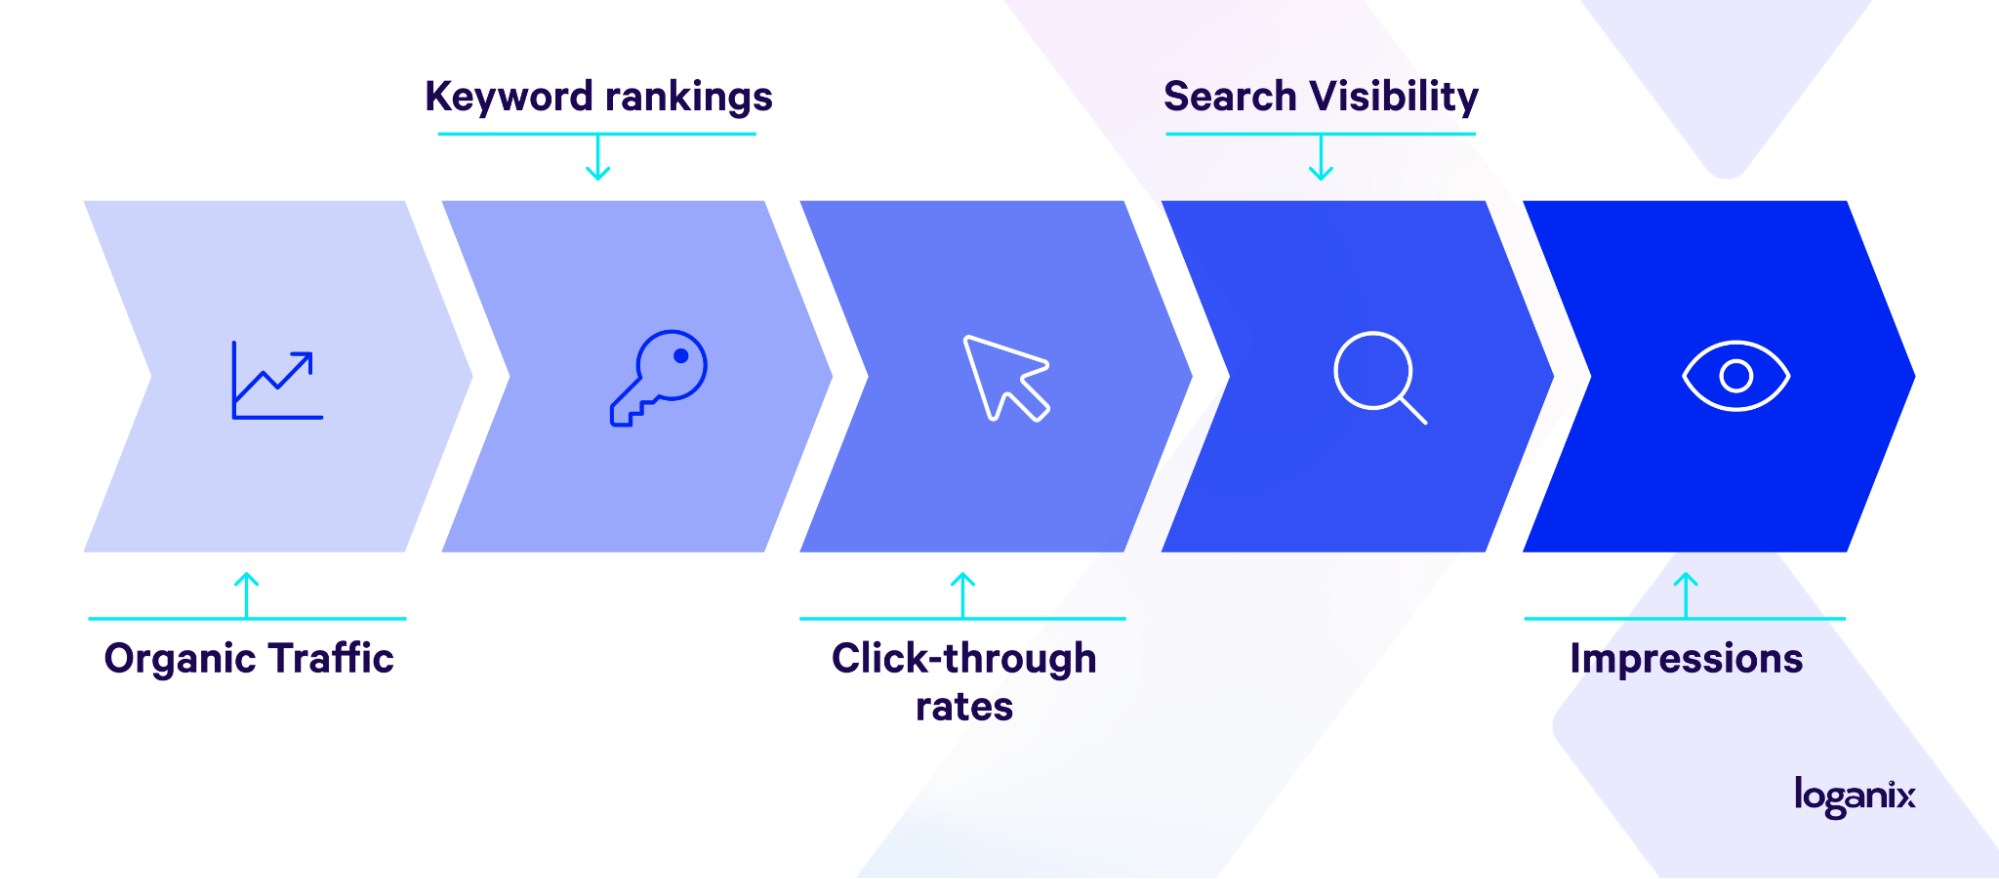
Organic Traffic
This goes without saying: organic traffic, meaning the visitors who find a website through unpaid search results as opposed to paid advertisements, is literally the lifeblood of any website. The benchmark here? It’s hard to put a solid number on it. While some sites receive millions of monthly organic visits, most receive little to none.
So, a good place to start is to aim for year-over-year increases. A touch of competitor analysis never goes astray here, either. Knowing how your competitors are performing acts as a good reference point.
2. Keyword rankings
Keyword rankings show you where a website appears in search results for specific keywords, giving you valuable insight into your visibility and potential to attract organic traffic.
The benchmark? It’s difficult to say. Keyword rankings are highly variable and depend on factors such as competition, search intent, and content quality, so it’s impossible to set a solid benchmark here.
A general rule of thumb? For a site’s primary keywords, aim to land within the top 10 results, but of course, the closer to the #1 spot, the better.
For highly strategic and high-conversion keywords? Targeting the top 3 positions is ideal, as these spots capture the majority of user clicks. Analyzing your competitors’ rankings will give you a feel of what you can achieve and help you set realistic goals.
Click-through rates (CTR)
CTR, or click-through rate, is the percentage of people who actually click on a website when it shows up in search results.
What’s a good CTR? Well, it depends. For instance, this case study showed that position one gets approximately 39.8% CTR, position two lands around 18.7% CTR, and position three has approximately 10.2% CTR. Each position below position three receives increasingly fewer clicks.
Search Visibility
Search visibility is a metric that shows how prominently a website appears in search results for a set of target keywords. It’s expressed as a percentage, with 100% meaning a site holds the top position for all tracked keywords and 0% indicating no visibility.
So, what’s a good search visibility score? Aiming for a visibility score above 50% is generally considered strong, but an “ideal” visibility percentage will vary based on factors such as industry competitiveness and the number of keywords tracked.
Impressions
Impressions are simply the number of times a website appears in search results, even if people don’t actually click on it.
So, what’s a good benchmark for impressions? Again, this can be very difficult to put a number on because there are vast differences in industries, target audiences, and content strategies. So, forget about a specific number. Instead, focus on consistent growth over time. Are impressions increasing month over month? That’s a good sign a website is gaining visibility.
2. Technical SEO Metrics

Right-e-o, let’s move onto the technical side of things.
Page speed scores
Page speed is measured in load time, which is the time it takes for a web page to fully display its content. Benchmark? Aim for a page load time under 3 seconds, ideally under 2 seconds, especially on mobile devices where connections can be slower.
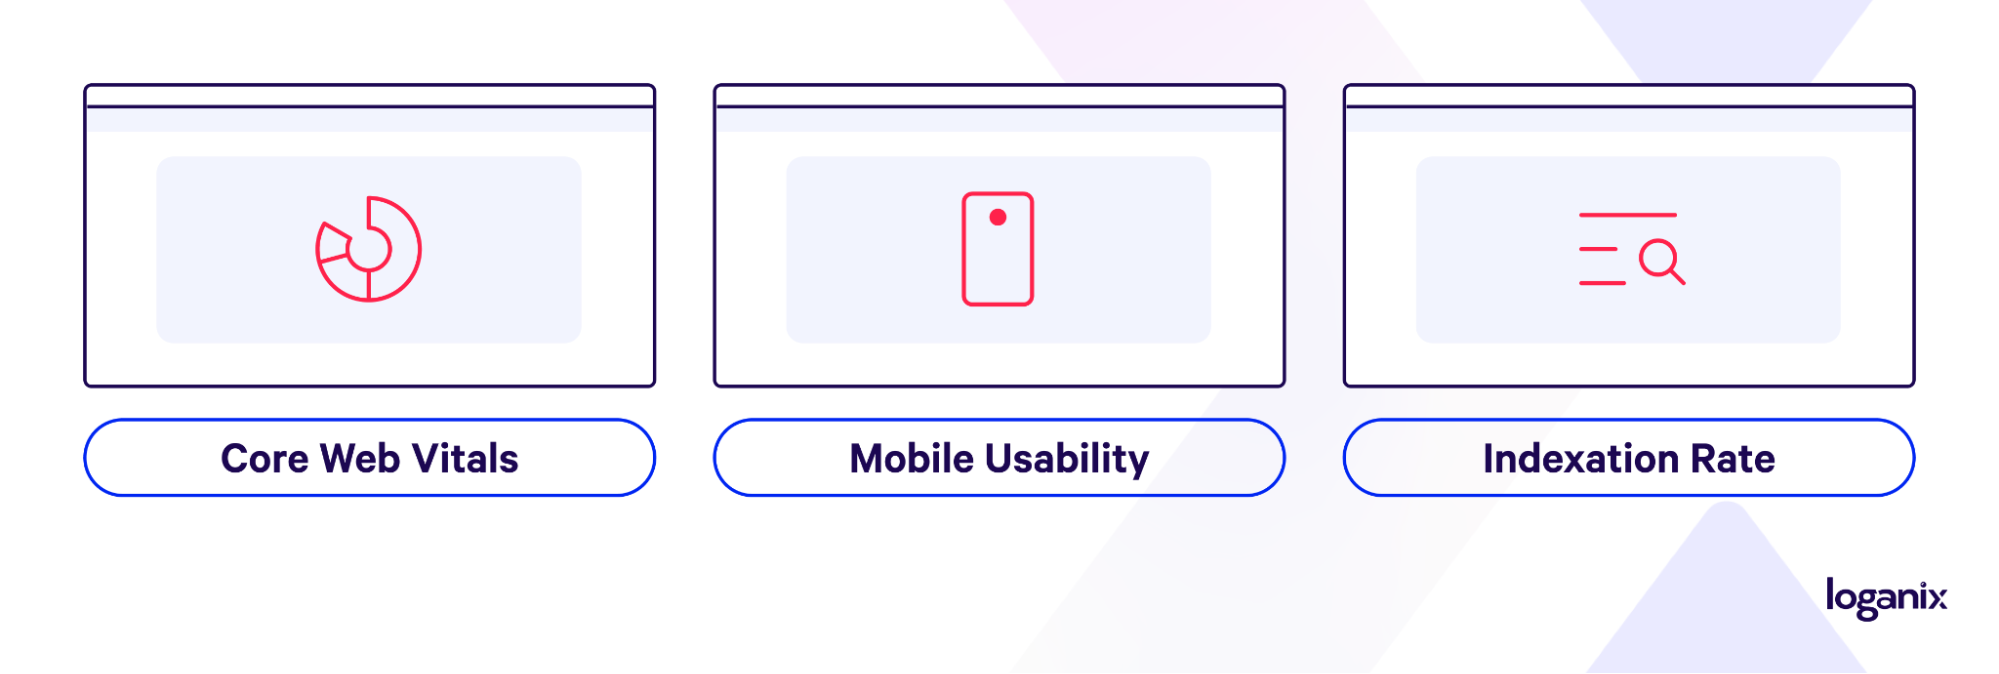
Core Web Vitals
Core Web Vitals are a set of three metrics that measure how quickly a website loads, how interactive it is, and how visually stable it is.
Aim for:
- Largest Contentful Paint (LCP): Measures how long it takes for the largest element on your page to load. Aim for an LCP of 2.5 seconds or less.
- Interaction to Next Paint (INP): Measures how long it takes for your page to become interactive. Aim for an INP of 200 milliseconds or less.
- Cumulative Layout Shift (CLS): Measures how much your page’s layout shifts around as it loads. Aim for a CLS of 0.1 or less.
Mobile Usability
Mobile usability: think good UX, happy users. Simple enough, so benchmarks? Responsive design (adapts to any screen), lightning-fast load times (under 3 seconds, ideally 2), easy navigation, tap-friendly buttons, readable text—basically, a smooth, frustration-free experience.
Indexation Rate
The indexation rate is the percentage of a website’s pages that Google has actually added to its index. If your pages aren’t being indexed, they won’t show up in search results. Simple as that.
A benchmark? If you’re doing everything right, an indexation rate of around 90% is where you want to land. Anything more than that, and you’re killing it because the harsh truth is that not every page published on a website will be indexed.
3. User Engagement Metrics

It’s time to throw it over to site visitors and how their actions affect rankings.
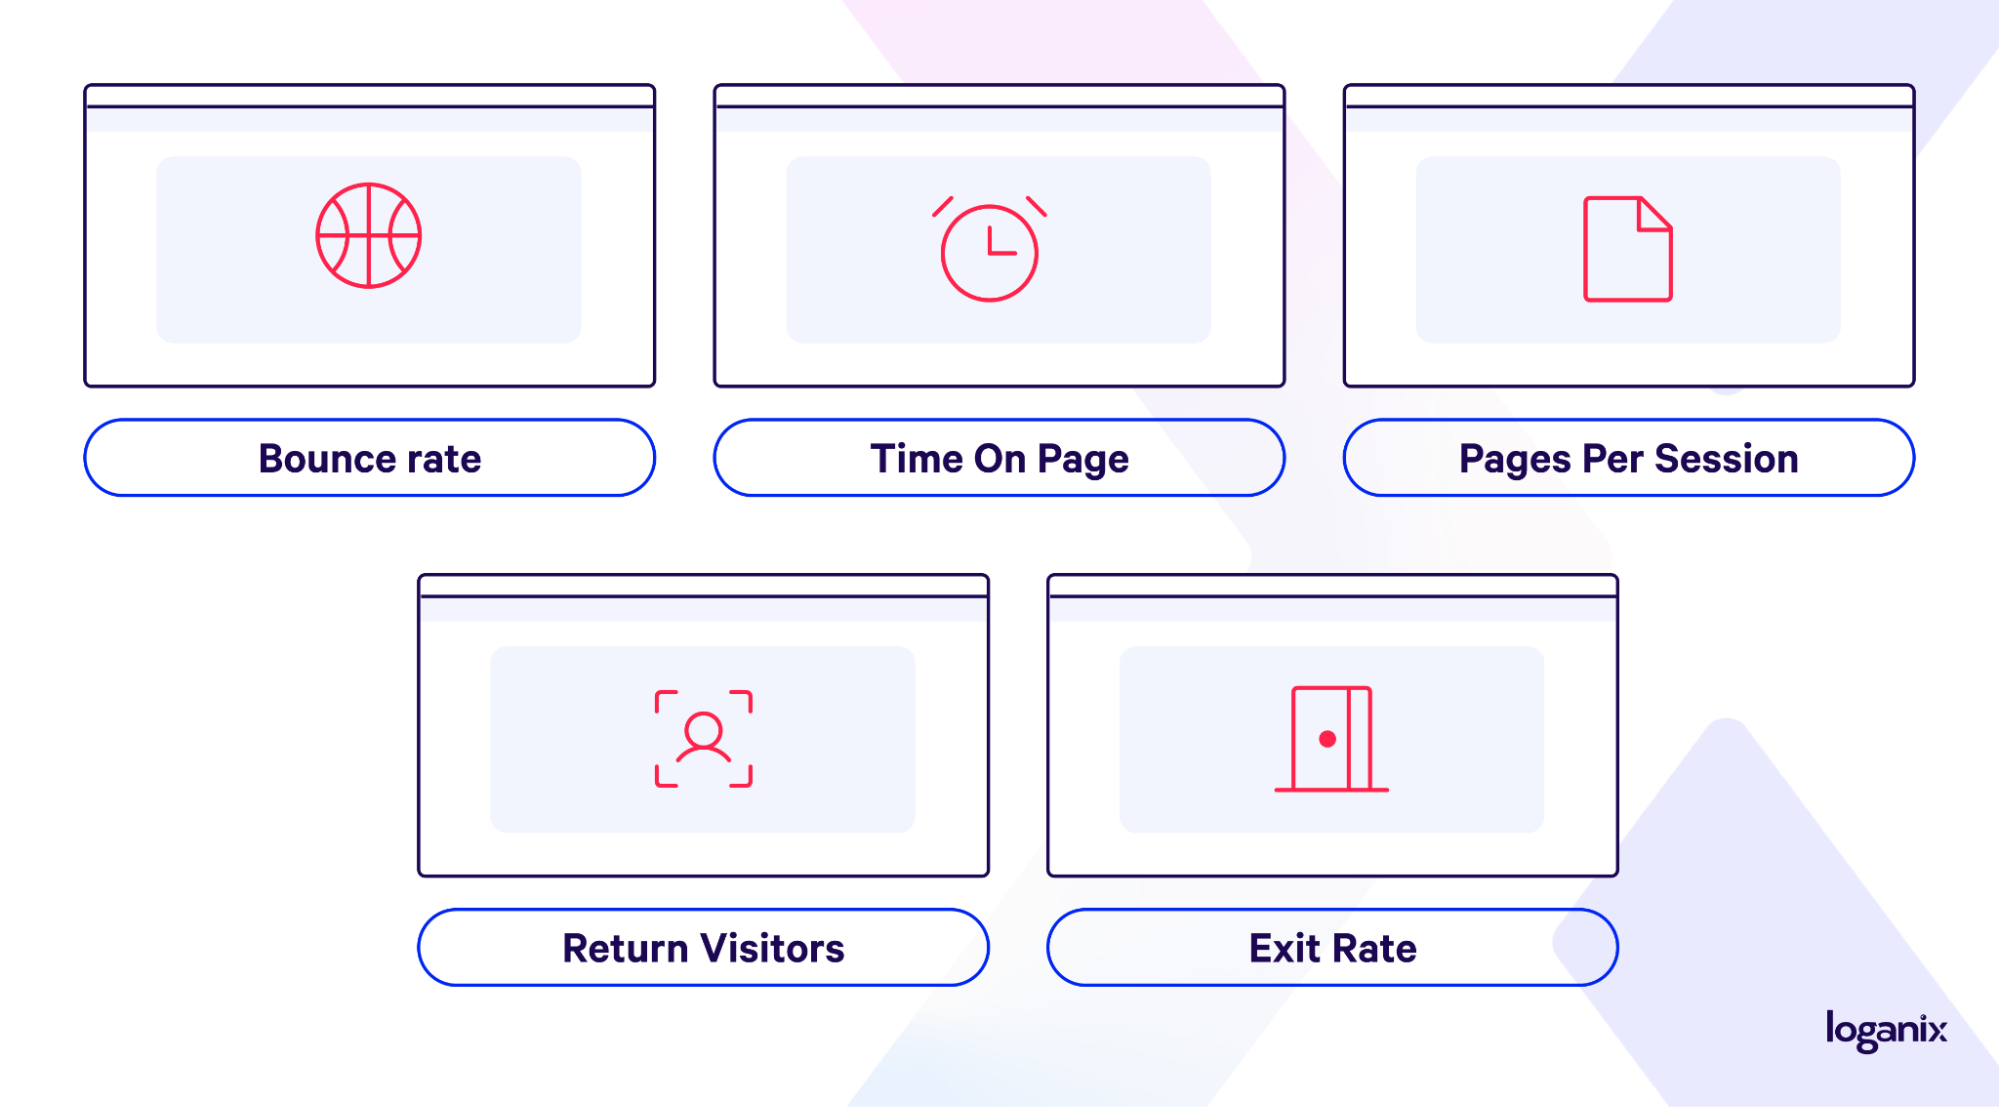
Bounce rate
Bounce rate: the percentage of visitors who land on a site and leave without checking out any other pages. A high bounce rate signals problems—maybe a site’s content doesn’t meet search intent, the site is hard to navigate, or it just loads too slowly.
Benchmark? Based on general bounce rate benchmarks, an excellent bounce rate falls within the 26-40% range, while the average is between 41% and 55%. Above-average bounce rates range from 56% to 70%, and anything above 70% is considered high.
Time On Page
Time on page is exactly what it sounds like: how long visitors spend on a particular page. It’s a key indicator of engagement. If people are sticking around, it means your content is resonating with them.
Across industries, the average time on page hovers around 52-54 seconds, but this can vary wildly. B2B sites often see higher engagement, averaging around 1 minute 22 seconds, while B2C sites tend to be a bit higher at about 1 minute 32 seconds. These are just averages, though—your specific goals will depend on the niche and content.
Pages Per Session
Pages per session: a metric that tracks how many pages a visitor views during a single visit to a website. It’s a good measure of how engaging a site is and how well a site’s internal linking is working. The more pages a visitor explores, the more likely they are to convert or become a loyal reader.
Benchmarks, what are we looking at here? Across various industries, the average number of pages per session is around 2.6, but top performers see much higher numbers—over 4 for the top 20% and upwards of 5.2 for the top 10%.
Industry-specific averages can vary significantly, though. Grocery sites tend to have high engagement, with around seven pages per session, and travel/hospitality see similar numbers, particularly on desktop. B2B sites often have lower engagement, averaging around two pages per session.
Return Visitors
Return visitors: these are the folks who liked what they saw and came back for more. They’re your loyal readers, your return customers, and the backbone of a successful website.
A high percentage of return visitors indicates you’re building a valuable audience. The percentage of returning visitors is a key indicator of user engagement, and while optimal rates vary by industry, some general benchmarks exist.
An average return rate typically falls between 20% and 40%, with a good rate exceeding 30%. Ideally, you should aim for somewhere between 30% and 50%, depending on your specific industry.
Exit Rate
Exit rate: this metric shows the percentage of visitors who leave a website from a specific page, regardless of how they arrived there. It’s important to understand where people are exiting so you can identify potential issues and optimize your site.
A typical exit rate falls below 40-50%, suggesting most users explore multiple pages before leaving. However, context is key.
A high exit rate on a key page (like a product page or landing page) could indicate a problem. Maybe the content isn’t compelling, the call to action is unclear, or the page is loading slowly.
Aim for product page exit rates around 40-60% to encourage further exploration or purchases. Conversely, a high exit rate on a “thank you” page or a blog post after someone’s finished reading isn’t necessarily a bad thing. Articles and blog posts often have exit rates between 60-90% as users leave after consuming the content.
Homepages typically see exit rates of 40-60%, reflecting their role as gateways, while category pages ideally have lower exit rates of 20-40% to guide users deeper into the site.


4. Content Performance
Onto the important stuff: content.
Top Pages
Top pages: these are the pages on a website that get the most traffic. They’re the ones bringing in the most visitors and often driving the most conversions. Understanding what content connects with your audience and finding ways to improve it depends on knowing which of your pages are most popular.
This is another one of those metrics that make it hard to set a benchmark. However, as a general rule of thumb, aim for a steady increase in organic visits to top pages over time. Strive for an average time on page that reflects deep engagement, typically over 2 minutes.
Content Gaps
Content gaps: these are the topics your target audience is searching for that you haven’t covered on your website yet. Identifying content gaps is super important for expanding your reach, attracting new visitors, and establishing yourself as an authority in your niche.
Benchmarks? A great place to start is to examine the topics and keywords your competitors are targeting, especially those where they rank highly and you do not.
Keyword Coverage
Keyword coverage: this refers to the range of keywords a website is ranking for in search results. It’s not just about ranking for a few top keywords; it’s about covering a broad range of relevant terms that your target audience is searching for. Good keyword coverage means a site is capturing traffic from various search queries and maximizing its visibility.
So, what are we looking at here in terms of benchmarks? Aim for a balanced mix of short-tail and long-tail keywords across your content. Short-tail keywords drive broad traffic, while long-tail keywords often capture more specific user intent, leading to higher conversion rates. Also, align your content with the search intent behind each target keyword, whether informational, navigational, or transactional.
Featured Snippets
Featured snippets: these are the concise summaries that Google pulls from web pages and displays at the top of search results, often in “position zero.”
Okay, benchmarks: on average, featured snippets receive a CTR of 35.1% of the total click share for a single search. If your featured snippets are getting around this, you’re on the right track.
Content Freshness
Content freshness is, you got it, how “fresh” or how recently a piece of content was updated. Search engines favor fresh content, as it signals that your website is active and providing valuable information. Outdated or stale content can hurt your rankings and drive visitors away.
Benchmark? Aim to review and update existing content at least every 6 to 12 months. This ensures information remains accurate and relevant.
5. Link-Building Metrics


Last but not least, link-building, baby!
Domain Authority
Domain Authority (DA): Developed by Moz, DA is a metric that predicts how well a website will rank in search results. It’s a score from 1 to 100, with higher scores indicating greater authority. While Google doesn’t directly use DA in its ranking algorithm, it’s a useful metric for comparing your site to competitors and tracking your SEO progress over time.
Benchmarks: scores between 40 and 50 are generally considered average, while 50-60 is good, and anything above 60 is excellent.
Referring Domains
Referring domains: these are the unique websites that link back to a site—a crucial component of a backlink profile and a strong indicator of a site’s authority and trustworthiness in the eyes of search engines.
For local businesses, a good entry-level goal is 50-100 referring domains, including local directories and industry platforms. National businesses should aim higher, targeting 100-300 referring domains through industry directories, press releases, and partnerships. Major brands often target 300+ referring domains, focusing on national press and high-authority listings.
Link Quality Scores
Link quality scores are a way to assess the value and impact of the backlinks pointing to a website. ‘Cause, as the overused adage goes: not all links are created equal. A link from a high-authority, relevant website is far more valuable than a link from a low-quality, spammy site.
Benchmarks? A good link quality score lands between 7 and 10 on a scale where higher numbers indicate better link quality, meaning the link is from a reputable, relevant website with high authority in the eyes of search engines. A score of 8-10 is considered excellent.
Citation Flow
Citation Flow is a metric developed by Majestic that measures the quantity of links pointing to a website. Citation Flow (CF) is scored from 0 to 100, reflecting the sheer volume of backlinks.
A CF of 0-20 suggests a lower number of backlinks or links from less influential sites, while 21-40 reflects a moderate profile, 41-60 a strong profile, 61-80 a very strong one, and 81-100 an exceptional backlink profile. While not a direct ranking factor itself, Citation Flow can provide insights into a website’s overall link profile and its potential influence.
A website with a high Citation Flow but low Trust Flow (Majestic’s other metric) might have a lot of low-quality or spammy links. A healthy Trust Flow to Citation Flow ratio is important to consider.
Ideally, Trust Flow should be close to or exceed Citation Flow. For example, a CF of 50 with a TF of 40 is good, but a CF of 50 with a TF of 20 suggests low-quality links. Use Citation Flow in conjunction with other metrics, like Trust Flow and Domain Authority, to get a more complete picture of a website’s link profile.
Trust Flow
I just covered it, but to fill in all the blanks: Trust Flow measures the quality of the backlinks pointing to a website. It’s based on the idea that links from trusted and authoritative websites are more valuable than links from less reputable sites. Trust Flow is also scored from 0 to 100, with higher scores indicating greater trust.
Scores above 50 are generally considered strong, reflecting a robust backlink profile. Scores between 10 and 50 are typical for many websites, indicating a moderate level of trust, while scores below 10 suggest a weaker backlink profile, potentially due to low-quality links.
Conclusion and Next Steps
Now that you’re armed with this knowledge, it’s time to put it into action.
That’s where we come in.
At Loganix, our team of SEO experts will help you identify a site’s strengths and weaknesses, develop a tailored strategy, and implement the tactics needed to achieve your SEO goals.
Ready to take your SEO to the next level?
🚀 Visit our SEO services page to learn more and schedule a consultation. 🚀
Hand off the toughest tasks in SEO, PPC, and content without compromising quality
Explore ServicesWritten by Brody Hall on April 30, 2025
Content Marketer and Writer at Loganix. Deeply passionate about creating and curating content that truly resonates with our audience. Always striving to deliver powerful insights that both empower and educate. Flying the Loganix flag high from Down Under on the Sunshine Coast, Australia.


